

According to PEW, prescription drug spending in the U.S. is projected to overtake other sectors of healthcare in 2018. Read this blog post to learn more.
This fact sheet was updated on April 26, 2018, to reflect newly published data.
Overview
Spending on prescription drugs in the United States is on the rise and is projected to outpace growth in other parts of the healthcare sector in 2018.1 Limited public data on how much various payers and supply chain intermediaries pay for prescription drugs, as well as a lack of consensus on a single metric for drug expenditures, presents methodological challenges in measuring drug spending.
See also: Specialty Drugs and Health Care Costs
Nevertheless, a number of public and private organizations have published drug spending estimates over the past several years, including the share of health spending attributed to drugs. Historical estimates and spending projections from the Department of Health and Human Services’ Assistant Secretary for Planning and Evaluation (ASPE), the Centers for Medicare & Medicaid Services’ (CMS’) National Health Expenditure Accounts (NHEA), the Altarum Institute, and IQVIA are explored in Figures 1 and 2.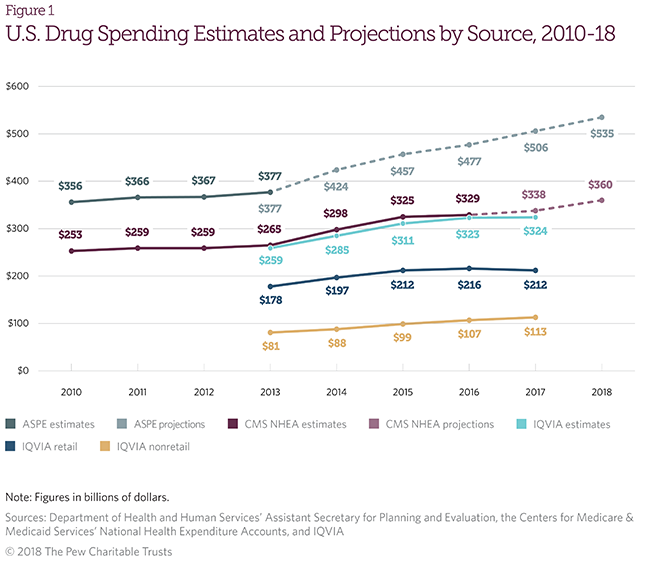
Figure 1 illustrates estimates and projections of U.S. drug spending by source from 2010 to 2018. Each incorporates rebates and spending on drugs, excluding over-the-counter (OTC) products.
- ASPE estimates total prescription drug spending, including retail and nonretail, using CMS NHEA, IQVIA, and Altarum Institute data.2
- CMS’ NHEA data provide estimates of retail prescription drug spending, excluding nonretail.3
- IQVIA estimates total manufacturer revenue (“net price spending”), accounting for rebates and other price concessions.4 IQVIA also breaks down manufacturer revenue for drugs sold in both retail and nonretail settings.
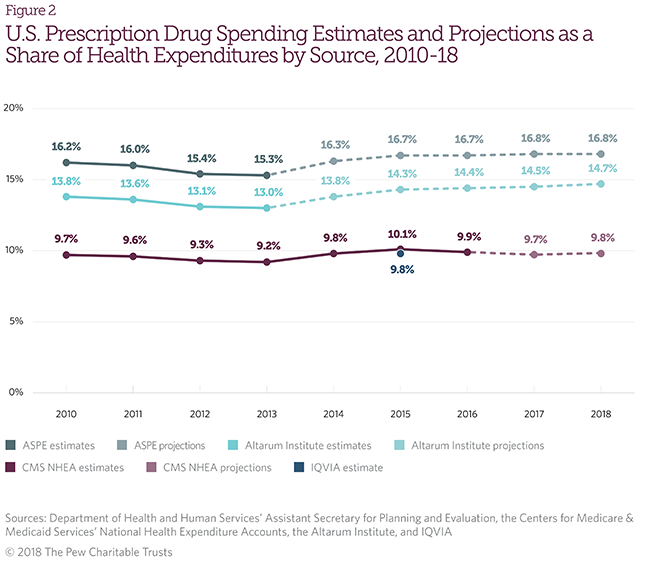
Figure 2 illustrates drug spending as a percentage of health expenditure. Each of these estimates incorporates rebates and spending in retail and nonretail settings excluding OTC products, unless noted below.
- ASPE estimates total drug spending (retail and nonretail) as a percentage of personal health expenditures, a subset of national health expenditures.5
- The Altarum Institute estimates total prescription drug spending (retail and nonretail) as a percentage of total national health expenditures.6
- CMS NHEA estimates drug spending (excluding nonretail) as a percentage of total national health expenditures.7
- IQVIA estimates net drug spending (retail and nonretail) as a percentage of health care spending, including OTC products that do not require a prescription.8
See also: How employers can manage the skyrocketing cost of specialty drugs
Organizations use different denominators to describe health care expenditures
- National health expenditures: Total health expenditures, including medical spending and public health activities, administrative costs, and research investments (Altarum Institute and CMS).
- Personal health expenditures: Spending exclusively on direct patient care (ASPE).
- Healthcare spending: An estimate of health care spending from the World Health Organization (IQVIA).
What drug spending estimates include
- Rebates: Drug price reductions intended to increase sales through formulary placement. While the method used to calculate the rebate is specified at the time of purchase, the actual rebate is received in the future, as it is based on product sales. Most rebates are paid to pharmacy benefit managers and health plans. Rebates are accounted for in all five estimates, but none of the organizations has access to the specifics of manufacturer agreements.9 IQVIA approximates rebates and other price concessions using publicly available wholesaler and pharmaceutical sales data, public financial filings, the Medicare trustees’ report, and proprietary audits. CMS NHEA adjusts estimated drug expenditures to account for rebates in retail and mail-order settings.10 Altarum Institute and ASPE apply CMS’ rebate adjustments to their drug expenditure estimates.
- Payers: Entities other than patients responsible for paying health care costs. In the United States, payers generally include insurance companies, health plan sponsors—such as employers or unions—and pharmacy benefit managers. Medicare is the nation’s largest payer. CMS NHEA data include estimates of pharmaceutical expenditures by private health insurers and public health insurers such as Medicare and Medicaid. CMS NHEA data also incorporate the amount that premiums contribute to the cost of pharmaceuticals, though the data do not include the share of premiums that go toward pharmaceuticals. IQVIA does not directly incorporate patient premiums in its drug spending estimates. CMS NHEA data include nonretail prescription drug spending in overall health expenditures but do not separately report spending on nonretail drugs. Spending on drugs in these sites of care is included in overall health cost estimates for each respective setting (for example, drugs purchased by hospitals are reported as hospital spending). The Altarum Institute uses IQVIA data to estimate spending on nonretail prescription drugs. ASPE also publishes an estimate of pharmaceutical spending for both retail and nonretail outlets.
- Over the counter: Drugs that do not require a prescription. Only the IQVIA estimate for net drug spending as a percentage of health care spending incorporates spending on OTC products.
- Retail prescription drugs: Drugs sold in a retail setting, such as a pharmacy, drugstore, mail-order, or other mass-merchandising establishment.
- Nonretail prescription drugs: Drugs dispensed in clinics and institutional settings such as hospitals, long-term care facilities, and nursing homes.
Endnotes
- Gigi A. Cuckler et al., “National Health Expenditure Projections, 2017–26: Despite Uncertainty, Fundamentals Primarily Drive Spending Growth,” Health Affairs 37, no. 3 (2018): 553–63, https://doi.org/10.1377/hlthaff.2016.1627; Centers for Medicare & Medicaid Services, “National Healthcare Expenditure Data,” accessed February 14, 2018, https://www.cms.gov/Research-Statistics-Data-and-Systems/Statistics-Trends-and-Reports/NationalHealthExpendData.
- Department of Health and Human Services, Office of the Assistant Secretary for Planning and Evaluation, “Observations on Trends in Prescription Drug Spending” (2016), https://aspe.hhs.gov/pdf-report/observations-trends-prescription-drug-spending. ASPE figures rely on data from the NHEA and the Altarum Institute. ASPE expenditures are available from 2009 to 2013 and projections from 2014 to 2018. This was a one-time publication.
- Centers for Medicare & Medicaid Services, “National Healthcare Expenditure Data.” CMS data are sourced from Census Bureau retail data, Medicare and Medicaid claims, and IQVIA data. CMS expenditures are available from 1970 to 2016 and projections from 2017 to 2026. CMS publishes these data annually.
- IQVIA, “Medicines Use and Spending in the U.S.: A Review of 2017 and Outlook to 2022” (2018), https://www.iqvia.com/institute/reports/medicine-use-and-spending-in-the-us-review-of-2017-outlook-to-2022. IQVIA data are sourced from wholesaler and pharmaceutical company sales information. IQVIA publishes expenditures from 2013 to 2017 and projections from 2018 to 2022. It updates this publication annually.
- Department of Health and Human Services, Office of the Assistant Secretary for Planning and Evaluation, “Observations on Trends in Prescription Drug Spending” (2016).
- Charles Roehrig, “A Ten Year Projection of the Prescription Drug Share of National Health Expenditures Including Non-Retail,” Altarum Institute (2017), https://altarum.org/sites/default/files/uploaded-publication-files/Non-Retail%20Rx%20Forecast%20Data%20Brief%20with%20Addendum%20May%202017.pdf.
- Centers for Medicare & Medicaid Services, “National Healthcare Expenditure Data,” accessed February 14, 2018, https://www.cms.gov/Research-Statistics-Data-and-Systems/Statistics-Trends-and-Reports/NationalHealthExpendData.
- IQVIA, “Understanding the Dynamics of Drug Expenditure: Shares, Levels, Compositions and Drivers” (2017) https://www.iqvia.com/institute/reports/understanding-the-dynamics-of-drug-expenditure-shares-levels-compositions-and-drivers. IQVIA data are sourced from wholesaler and pharmaceutical company sales information and the World Health Organization’s Global Health Expenditure Database from December 2016. This one-time publication includes expenditures from 1995 to 2015.
- IQVIA accounts for but does not report drug supply and payment chain entity profit retentions (e.g., discounts, rebates, chargebacks and other financial transactions among manufacturers, pharmacy benefit managers, pharmacies, and wholesalers).
- Centers for Medicare & Medicaid Services, “National Health Expenditure Accounts: Methodology Paper, 2015,” https://www.cms.gov/Research-Statistics-Data-and-Systems/Statistics-Trends-and-Reports/NationalHealthExpendData/Downloads/DSM-15.pdf.
SOURCE: PEW (27 February 2018) “A look at drug spending in the U.S.” (Web Blog Post). Retrieved from https://www.pewtrusts.org/en/research-and-analysis/fact-sheets/2018/02/a-look-at-drug-spending-in-the-us